I built a tool to measure DC performance of an ADC. Since I have it, I figured I may as well use it to investigate the four ADCs I have lying around- an esp32, and arduino uno (atmega328), SAMD21 based feather board, and the ADS1015. This post is about the data I want to collect and analyze.
Key Performance Indicators:
The things I look for in an ADC for DC performance are a high effective number of bits (including with oversampling), good monotonicity, low DNL and INL. All of these characteristics are related, but each one gives me a feel for the ADC, and only some of these are listed in datasheets.
Here is the data I intend to capture.
Standard Deviation + ENOB
The standard deviation per DAC output code is a good metric to start with. It is important to have resolution, but if the lower bits are twiddling back and forth seemingly randomly, they are not really useful. We can measure this twiddle and find out how many bits are useful- the effective number of bits (ENOB), for a single read. Even better, that twiddle might not be random- if we look at 100 codes and average them, we should get closer to the “real” value (oversampling).
I took 100 readings with the ADC per output code. The “true” value of the ADC is probably close to the mean of these readings. I calculated several standard deviations based on this mean- the standard deviation for the population of all readings, and then the standard deviation of oversampling 4x, 8x, and 16x.
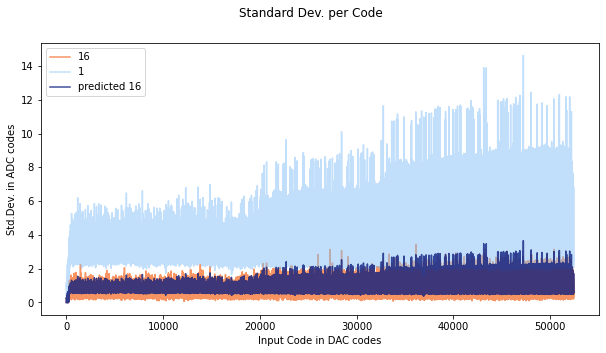
As the oversampling increases, the standard deviation of the population of oversampled results decreases. Basically since we are averaging a bunch of samples, the random error cancels out and we end up closer to the mean. The standard deviation should be reduced by a factor of 1/sqrt(n) where n is the number of samples (standard error). Here you can see the results of a run with the SAMD21. I plotted the 1x and 16x sampling, as well as the predicted 16x sampling (dark blue over orange). It is pretty cool to see the theoretical value line up with the measured value. If these don’t line up, its a sign that the errors are not random- and that means that oversampling wont actually help get close to the “true” value.

One artifact of calculating ENOB this way is that at the edge of a code, the standard deviation is going to be really high compared to mid-code. You can see this effect here- the xticks are set to be the width of an ADC code, but they are not aligned. Usually the standard deviation is pretty small, but it gets really big near what are likely code transitions. Since we usually don’t have a map of the whole ADC when we are measuring something, we have to take the worst case scenario (our measurement could be on a code). Still, averaging helps improve ENOB.
Monotonicity

Monotonicity is related to ENOB- the output codes should be monotonic at the effective number of bits. Since my reading from the ADC is in terms of averages of 100 readings, I will use the standard deviation/10, since the standard deviation should be reduced by sqrt(100 readings). The worst case standard deviation is about 14.5 LSB, so I chose to look at the output code every 1.5 LSB ADCs of input voltage.
In theory, this should always be a positive difference- the output code should increase by at least 1 every 1.5 lsbs. However, this is not the case. There are 39 non monotonic jumps, and each of them is only a little bit bad- about 1 LSB. In terms of the code/code plot. these correspond to flat spots, or places where the codes actually decrease, or are flat, as seen in the next section.
Max DNL
There are two DNL errors to look for, DNL<-1, which causes missing codes, and DNL>1, which causes non-monotonic (not always increasing) behavior. Looking for missing codes is easy and is done more or less by brute force – fortunately in this in this example, there were no missing codes.
It is not surprising to have codes be wider or skinnier than 1 LSB of the ADC. However, DNL>1 causes a the ADC output to be flat for a while- this means that we have extra error that we is hard to account for. I looked for codes that were more than 3 standard deviations from the mean width, and then plotted the errors. The widest code (aside from the expected nonlinearity near 0) was an astounding 7LSBs!

Max INL Measurement

To get the INL, I just took the sum of the DNL’s. Since I didn’t correct for offset in this case, there is a large jump in DNL at the start.
Conclusion:
I now have a tool for measuring real world DC performance of ADCs. I have a few ADCs lying around, and I want to figure out what kind of defects they have and compare them!
