This wont make much sense unless you have read the previous posts about leak testing my rebreather counterlung. These are more lab notes than anything. Also, there are no good pictures until the end.
Temperature-Pressure Dependence
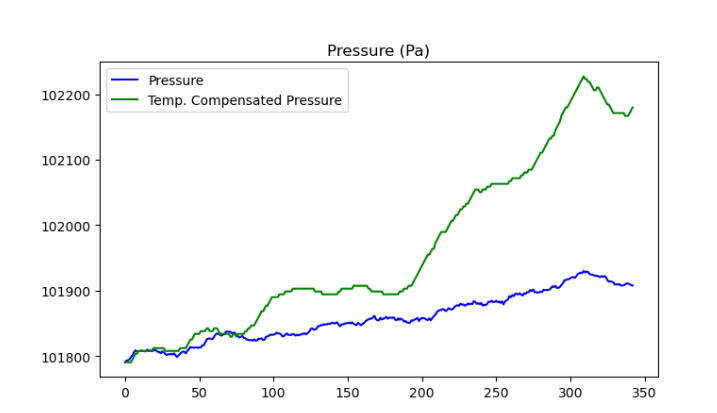
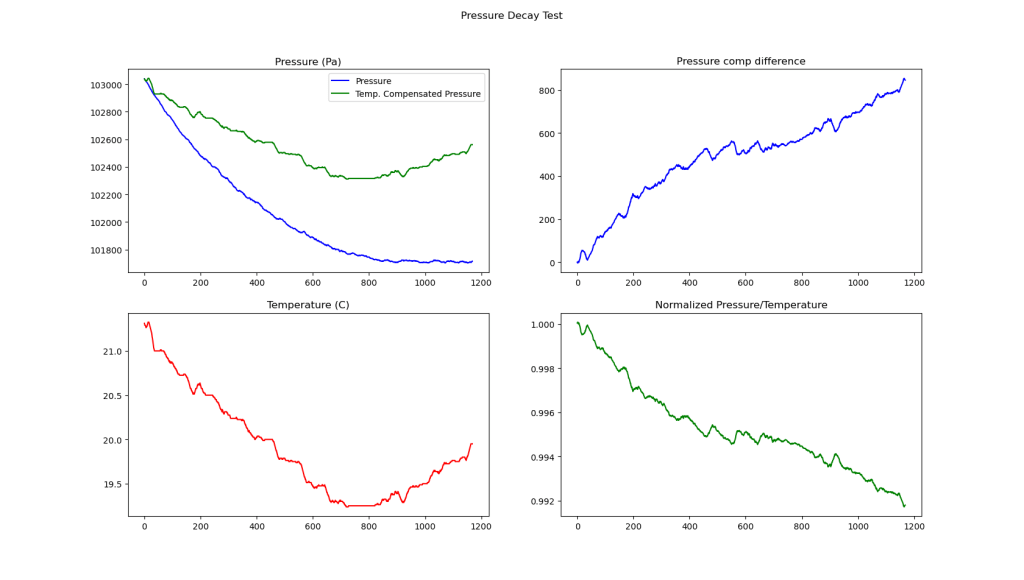
The first thing to do when you get some data is to ask if it makes any sense. Much of the time, some small mistake has been made, like inverting an axis. In this case, there is some strange behavior. The pressure (blue line) is going up. That is pretty weird since the volume is not changing, and gas is not being added to the device under test.
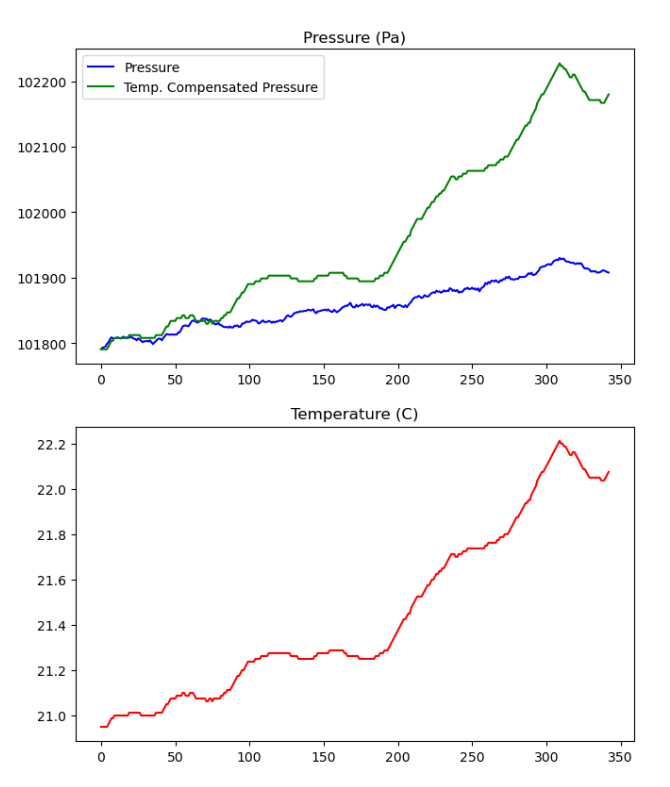
But now, looking at the temperature, it starts to make sense. if the whole room gets hot, and the air in the bag cant expand, the pressure will go up! I created the green line, which represents the expected pressure based on the initial temperature and pressure, assuming no change in volume. But as you can see, that line looks about right, but is quite a bit higher than the blue line.

Lets plot the difference- this is the temperature-compensated pressure drop after the whole test has run. The X axis here is roughly in minutes, so over six hours, it 300 Pa is the calculated difference between what was measured at the end of the test (accounting for pressure) and what we should have had! That is about 1.2″ H2O- a fairly small leak- about 30 ml of air at NTP, or .04 grams of gas.
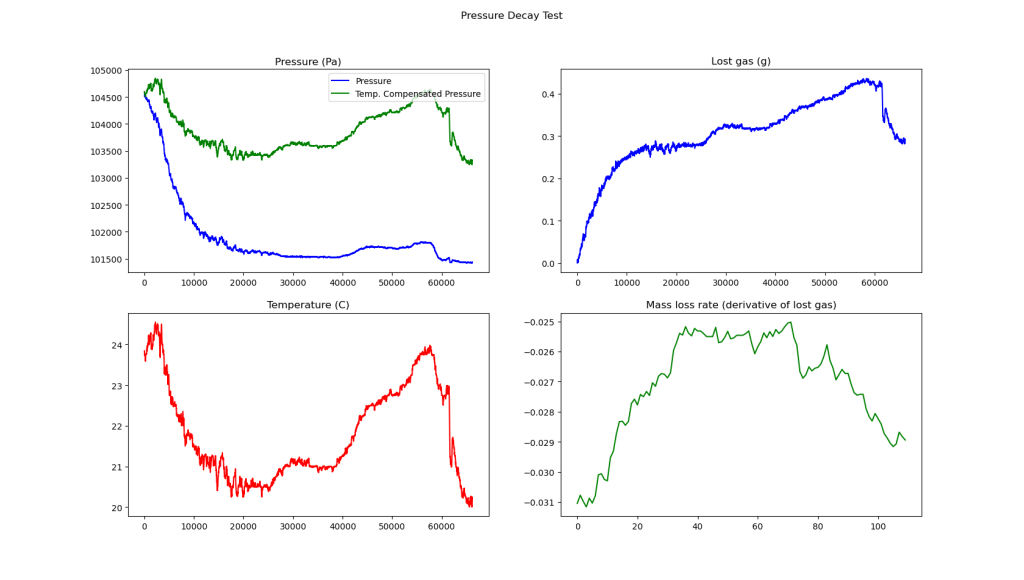
These are the final iteration of plots I am using to look at leak behavior. The first one is the temperature compensated pressure shown with the internal pressure. From here you can eyeball the pressure difference. This is displayed above the temperature chart, so its easy to see that temperature correlates to pressure. In the top right chart, the gas loss is shown, which is convenient since that is applicable to design. Finally, the bottom right chart shows gas loss rate. It is not as useful as I expected.
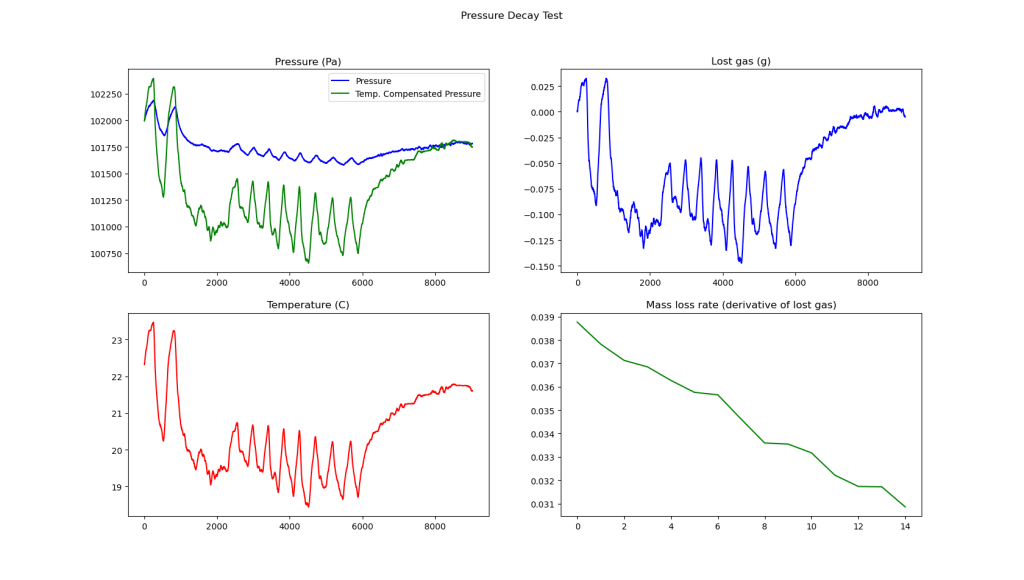
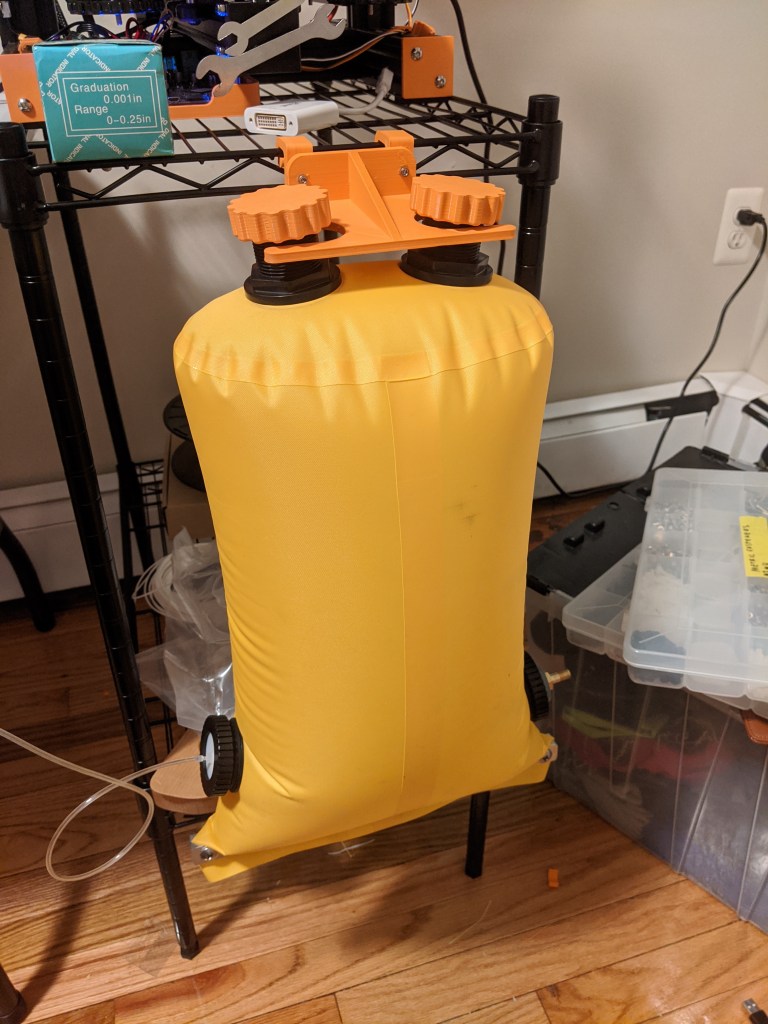
This was a long test done with the air conditioner on in a sunny room. Here there is some additional bad behavior. This test was done with the counterlung lying in a pool of water, with a thermocouple taped to the outside (on top). Interestingly, from the top two charts we see that we start and end with roughly the same gas volume- no leakage, which makes sense because this test was done at only 2.7 inches of water (~675 Pa), a very low pressure differential. However in the middle of the chart, the Temperature compensated pressure is up to ~900Pa lower than the measured pressure, which ends up going back to 0 at the end of the test.
This shows something that has not been compensated for- thermal lag of the air compared to the sensor, and any temperature difference between the air in the the bag and the the sensor. The sensor is very small, and is not well connected to the air in the bag, while the air in the bag is lying in a pool of fairly thermally stable water. However, the data still seems good if the temperature is allowed to settle, as it does towards the end of the test.
Leak Flow Behavior
In comparison to a lot of high pressure leak tests, the flow from the bag is certainly not “choked”, like it would be in something like a constant mass flow orifice. We know this theoretically, because the upstream pressure:downstream pressure ratio is only 1.03, and because it is easy to see that the leak rate changes significantly with pressure in the chart above.
Atmospheric Pressure
Unfortunately, barometric (atmospheric) pressure is very important for long term tests. Barometric pressure, usually reported in inches of mercury, changes throughout the day. 1″ Hg is 13.6″ of water, which is quite significant for these tests!
If the atmospheric pressure goes down 1″ Hg, the differential pressure should go up, while if the pressure increases, the pressure differential goes down. Since I am only measuring a pressure differential, ending and starting at different barometric pressures will throw the test off. However, short term test results or tests that are conducted on stable weather days seem like they should be ok. Obviously adding a barometer to this (an absolute pressure gauge) would make it much better but I don’t think I need that information to decide if my bag is airtight enough over the short term.
I do have a barometer, in my watch (and probably one in my phone, now that I think of it), but it is not simple to import that data into my testing process. However, the data I do have shows that the pressure is usually pretty stable- within 2-3 mbar, on “nice” days.
Conclusion
I think after all this testing that the leak rate seems low enough. Although there is technically a little bit more I could to to verify the leak rate, it seems like a roughly a few inches of water/hour, at ~15″ of water, which is the maximum operating pressure. Since the leak rate should go down with a smaller pressure difference, I expect to be well within the EN limits for a single valve. Before I do a bunch more testing, I will want to get all the rest of the fittings onto the counterlung.
Some notes on data:
A nominal atmospheric pressure and a 13 L volume were assumed for mass loss calculations.
Just to clarify why everything looks so smooth: data was smoothed with windowed averaging with a window size of 10, different data rates appear throughout the data, with the original tests I did being at a rate of 30s/sample and later tests being at ~1s/sample to provide better averaging.

One thought on “Leak Testing Notes+ Conclusion (?)”